|
|
Case Studies
This expected value analysis case study [real world,
sanitized model] is of a single oncology drug [product]
targeted for multiple late-stage cancers. The product
is in different phases for each indication, therefore the
probability of a positive outcome changes from one
indication to another; obviously a Phase III trial has a
greater likelihood of success, becoming a marketed product,
than does a Phase II trial for the same drug. In
addition, decision tree modeling of expected value looks at
the abandonment option; the option to abandon the project if
performance in unsatisfactory [i.e. a clinical trial goes
bad]. Other options are also modeled and include the
option to switch inputs or outputs, option to delay, option
to build, option to partner or option to grow.
Simple NPV weighting based on expected
probability of positive outcome:
-
'Expected probability of success' is
determined by empirical data and expert opinion.
-
'Non-weighted NPV' is what the product
specific / indication specific model values the product
at.
-
'Weighted or expected NPV' is the
adjusted NPV based on the 'expected probability of
success'.
|
Indication |
Phase |
Expected prob.
of success |
Non-weighted NPV [$000] |
Weighted or expected NPV [$000] |
|
|
Cancer 1 |
IV |
80% |
$360,000 |
$288,000 |
|
|
Cancer 2 |
II |
15% |
$140,000 |
$21,000 |
|
|
Cancer 3 |
III |
45% |
$470,000 |
$211,500 |
|
|
|
|
Totals: |
$970,000 |
$520,500 |
Expected value |
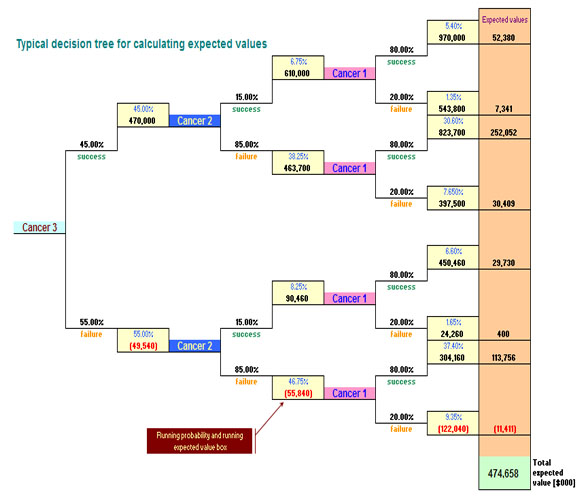
Decision tree modeling:
Decision tree modeling allows for
completely transparent and detailed visualization of the
expected value analysis. As you can see from the
decision tree below, running probabilities and running
expected NPVs are carried forward along all permutations
of each decision branch. The positive values are
obvious and given in the matrix above, in the
'Non-weighted NPV' column. The negative values
[abandonment options] are
derived within the product model itself and represent
certain amounts of sunk costs if parts of the project
were to fail along the way. The total expected
value for this project is $474,658 [000]. This
value is 8.8% smaller than our expected value in the
simple 'Weighted or expected NPV' analysis. The
difference can be explained in the fact that the
decision tree model utilizes the potential losses
whereas the matrix above does not. In addition,
the decision tree accounts for more variables and may be
considered a more accurate analysis in light of the
abandonment option at any node.
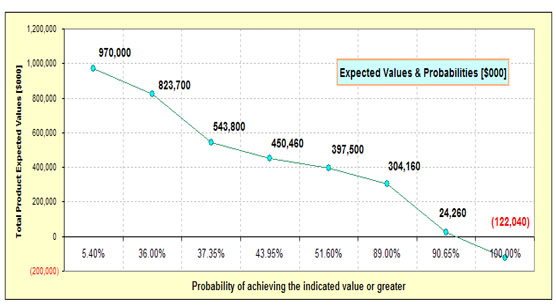
The chart below is representative of
expected values versus probabilities. For
instance, this project has a 51.60% probability of
having an NPV of $397,500 [000] or greater. This
chart has an x-intercept of 92.55%, taken directly from
the model. Effectively, the project has a 92.55%
probability of at least breaking even.
This expected value analysis is only a
very small portion of an entire financial modeling
system where a change in a seemingly unrelated part of
the model will propagate throughout modeling system.
This is a very powerful attribute of the SG Systems'
models. Particularly when during the midst of an
important presentation and a 'what if' question is
asked. You can simply make the change on-the-fly
and have the model updated in seconds.
Expected value analysis can be used on
single product, single application projects or on
multi-dimensional products spanning multiple product
lines and is not limited to pharmaceutical or
biotechnology industries.
Contact SG Systems for more information or to
arrange a consultation.
|