|
Case Studies
This expense model case study is based on a mid-stage,
patented oncology drug cocktail [real world, sanitized
data]. The expense model will get us to the expected
net income of the product and from there we can move forward
with calculating our expected cash flows, terminal values,
and net present values.
 Once
we have a sound revenue model in place
we can move forward with the integration of the expense
model and two of the first issues we deal with is 'Returns,
Discounts & Allowances' and 'COGS'. The line item
'Returns, Discounts & Allowances' can be a simple percentage
of total revenues or raw data whose genesis is from expert
opinion, empirical data, or sales force estimates.
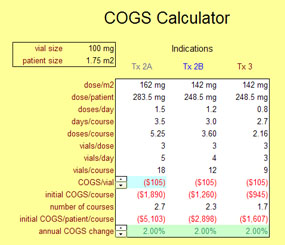
COGS, on the other hand, is typically a calculated value
that changes with time. Generally, we build a COGS
calculator to keep the values as transparent as possible.
Many of the inputs come from our
revenue model
while other data originate directly from manufacturing firms
and expert opinion. Once
we have a sound revenue model in place
we can move forward with the integration of the expense
model and two of the first issues we deal with is 'Returns,
Discounts & Allowances' and 'COGS'. The line item
'Returns, Discounts & Allowances' can be a simple percentage
of total revenues or raw data whose genesis is from expert
opinion, empirical data, or sales force estimates.
COGS, on the other hand, is typically a calculated value
that changes with time. Generally, we build a COGS
calculator to keep the values as transparent as possible.
Many of the inputs come from our
revenue model
while other data originate directly from manufacturing firms
and expert opinion.
After the COGS are derived and applied, we
begin to develop our partnering and licensing section.
Upfront payments, milestone payments and schedule, and
royalty rates are defined and calculated. Please see
our Licensing and
Partnering page for more details on deal term modeling.
We then account for capital expenditures and
depreciate these costs accordingly, later, in the net income
section of the expense model and in the
cash flow model.
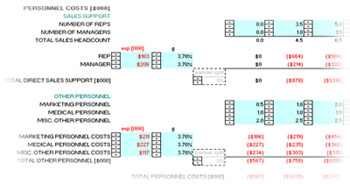
 Personnel
costs have a unique aspect to them; they are truly dependent
on regional pay rates. For instance, a sales
representative in one region may expect a totally different
compensation package than a sales representative in a
different region. And, of course, the total cost for
these different compensation packages will not be equal.
Personnel costs make up a significant portion of the overall
expense associated with a specific product. Therefore
it is critically important that these costs are accurately
modeled. Otherwise there exists the potential to
either dangerously underestimate the total expenses and
thereby under fund the capitalization requirements of the
project or to frivolously overestimate Personnel
costs have a unique aspect to them; they are truly dependent
on regional pay rates. For instance, a sales
representative in one region may expect a totally different
compensation package than a sales representative in a
different region. And, of course, the total cost for
these different compensation packages will not be equal.
Personnel costs make up a significant portion of the overall
expense associated with a specific product. Therefore
it is critically important that these costs are accurately
modeled. Otherwise there exists the potential to
either dangerously underestimate the total expenses and
thereby under fund the capitalization requirements of the
project or to frivolously overestimate
 the
total expenses and scare away potential investors by
reflecting narrower profit margins. the
total expenses and scare away potential investors by
reflecting narrower profit margins.
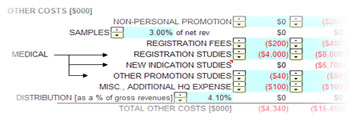
Other costs are the remaining expenses that
need to be modeled. Promotional expenses, drug sample
costs, an array of medical fees and expenses, product
directed headquarters' costs, and product distribution are
part of this case study. There are any number of
additional expenses that other projects will require.
Some of these items are simple, non-calculated vales, while
others are calculated by dependent functions.
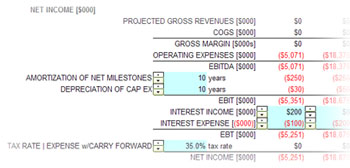
 Once
we have compiled all of our projected expenses and projected
revenues over a time period ranging from a few months to a
few decades, we can begin to calculate our pro forma net
income. The reporting of net income values occurs at
the intervals that were used for the other projected values.
The intervals can be any time period but are usually in
years. Often the models will have shorter reporting
periods of quarters or months when dealing with a marketed
product. It is at this point where the non-cash items
such as 'Amortization of Net Milestones' [see
Licensing and
Partnering for more details] and 'Depreciation of
Capital Expenditures' are factored into our net income
calculation. Our 'Tax Expense' is calculated here
using an SG Systems custom macro which accurately determines
the tax benefit of loss carry forward. This is a
particularly important aspect of financial modeling because
the carry forward effect has a direct effect on the future
cash flows and could possibly have significant impact on the
project capitalization requirements. Once
we have compiled all of our projected expenses and projected
revenues over a time period ranging from a few months to a
few decades, we can begin to calculate our pro forma net
income. The reporting of net income values occurs at
the intervals that were used for the other projected values.
The intervals can be any time period but are usually in
years. Often the models will have shorter reporting
periods of quarters or months when dealing with a marketed
product. It is at this point where the non-cash items
such as 'Amortization of Net Milestones' [see
Licensing and
Partnering for more details] and 'Depreciation of
Capital Expenditures' are factored into our net income
calculation. Our 'Tax Expense' is calculated here
using an SG Systems custom macro which accurately determines
the tax benefit of loss carry forward. This is a
particularly important aspect of financial modeling because
the carry forward effect has a direct effect on the future
cash flows and could possibly have significant impact on the
project capitalization requirements.
Now that we have the pro forma net income
statement developed, we can build the
cash flow model
where we will gat a much better picture of what the value of
the project is in today's dollars.
|

